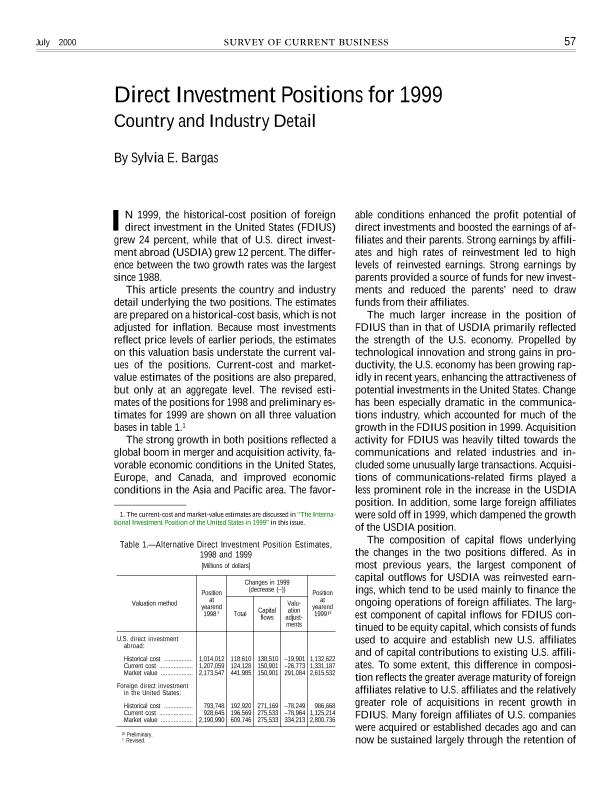
Direct investment positions for 1999 : country and industry detail

Contenido multimedia no disponible por derechos de autor o por acceso restringido. Contacte con la institución para más información.
| Tag | 1 | 2 | Valor |
|---|---|---|---|
| LDR | 00000nab a2200000 i 4500 | ||
| 001 | MAP20071508709 | ||
| 003 | MAP | ||
| 005 | 20080418130023.0 | ||
| 008 | 000101e20000701gbr|||| | |00010|eng d | ||
| 040 | $aMAP$bspa | ||
| 084 | $a921.94 | ||
| 100 | 1 | $0MAPA20080190583$aBargas, Silvia E. | |
| 245 | 1 | 0 | $aDirect investment positions for 1999$b: country and industry detail$cby Silvia E. Bargas |
| 520 | 8 | $aIn 1999, the historical-cost position of foreigndirect investment in the United States (FDIUS) grew 24 percent, while hat of U.S. direct investment abroad (USDIA) grew 12 percent. The difference between the two growth rates was the largest since 1988. This article presents the country and industry detail underlying the two positions. The estimates are prepared on a historical-cost basis, which is not adjusted for inflation. Because most investments reflect price levels of earlier periods, the estimates on this valuation basis understate the current values of the positions. | |
| 650 | 0 | 1 | $0MAPA20080579784$aCostes económicos |
| 650 | 1 | 1 | $0MAPA20080547271$aFinanzas |
| 650 | 1 | 1 | $0MAPA20080543419$aCartera |
| 650 | 1 | 1 | $0MAPA20080582418$aRiesgo financiero |
| 650 | 1 | 1 | $0MAPA20080562342$aEstadísticas |
| 650 | 1 | 1 | $0MAPA20080558970$aInversiones |
| 650 | 1 | $0MAPA20080568863$aEstados Unidos | |
| 650 | 1 | $0MAPA20080597641$aMercados financieros | |
| 773 | 0 | $dLondon$gJuly 2000 ; [12] p$tSurvey of Current Bussines |

